Open a chart on the service Tradingview.com, then go to "Indicators" - section "Invite-only Scripts". Then select our indicator "Market Map PRO"
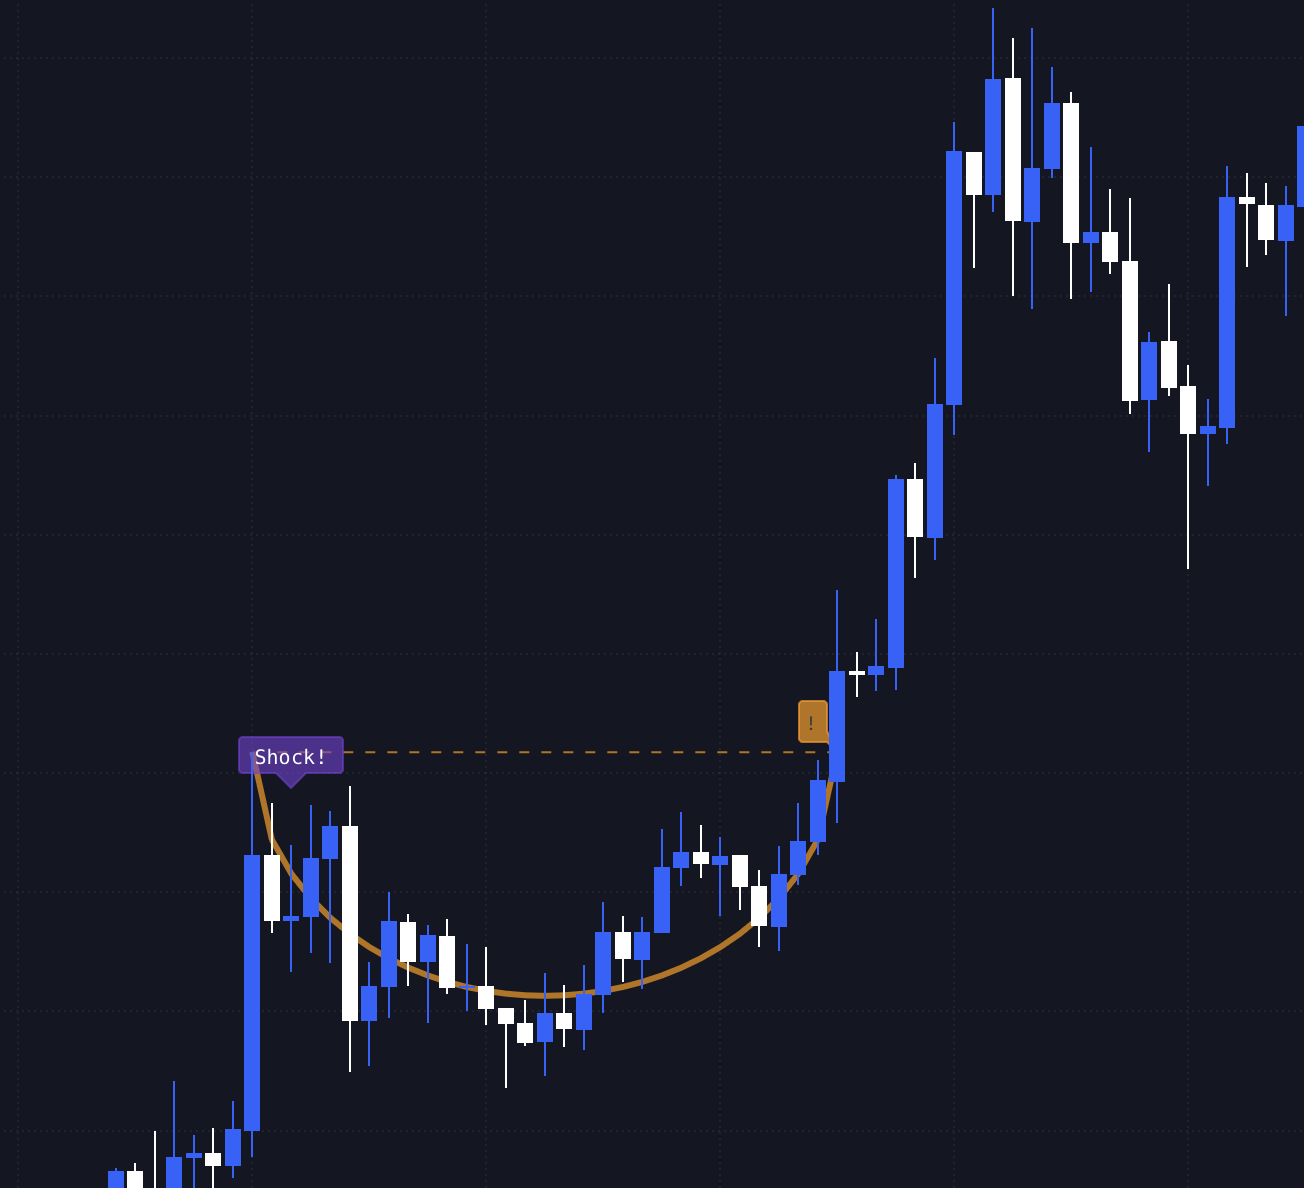
Use the 4h and 1 DAY timeframes. This is important because the indicator should only provide you with quality data. On other timeframes only "Shock" and "Dome" are displayed.
Alerts are available on the site in the "Bot" section. They come as soon as the signal is confirmed. Also, if you have a PRO subscription, you can request access to a closed Telegram group with alerts.
Signal function: search for technical analysis patterns with filtering (rising and falling wedge, triangles).
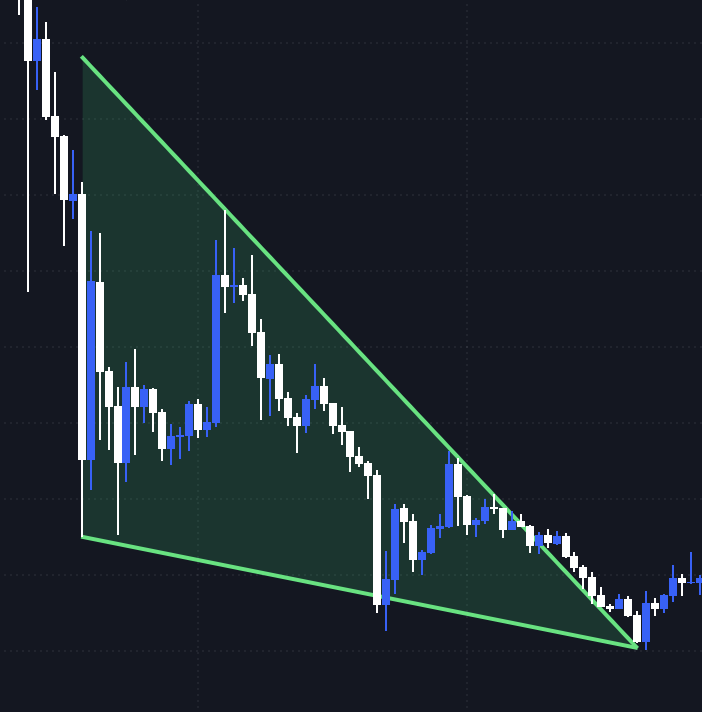
A green pattern means a high probability of growth of the asset when exiting the wedge.
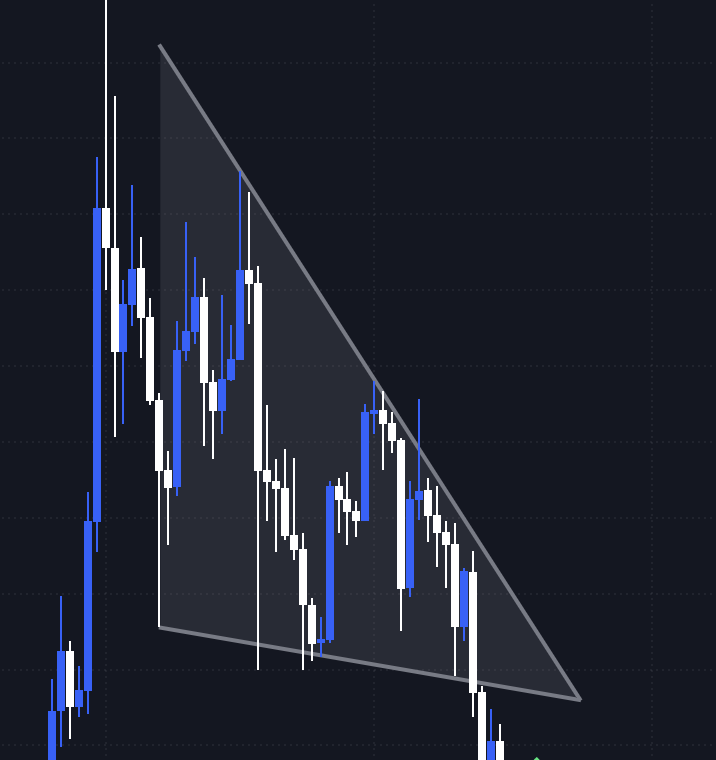
A gray pattern means that according to Tech Analysis theory such pattern should work upwards, but it will not happen due to the lack of a necessary situation in the market.
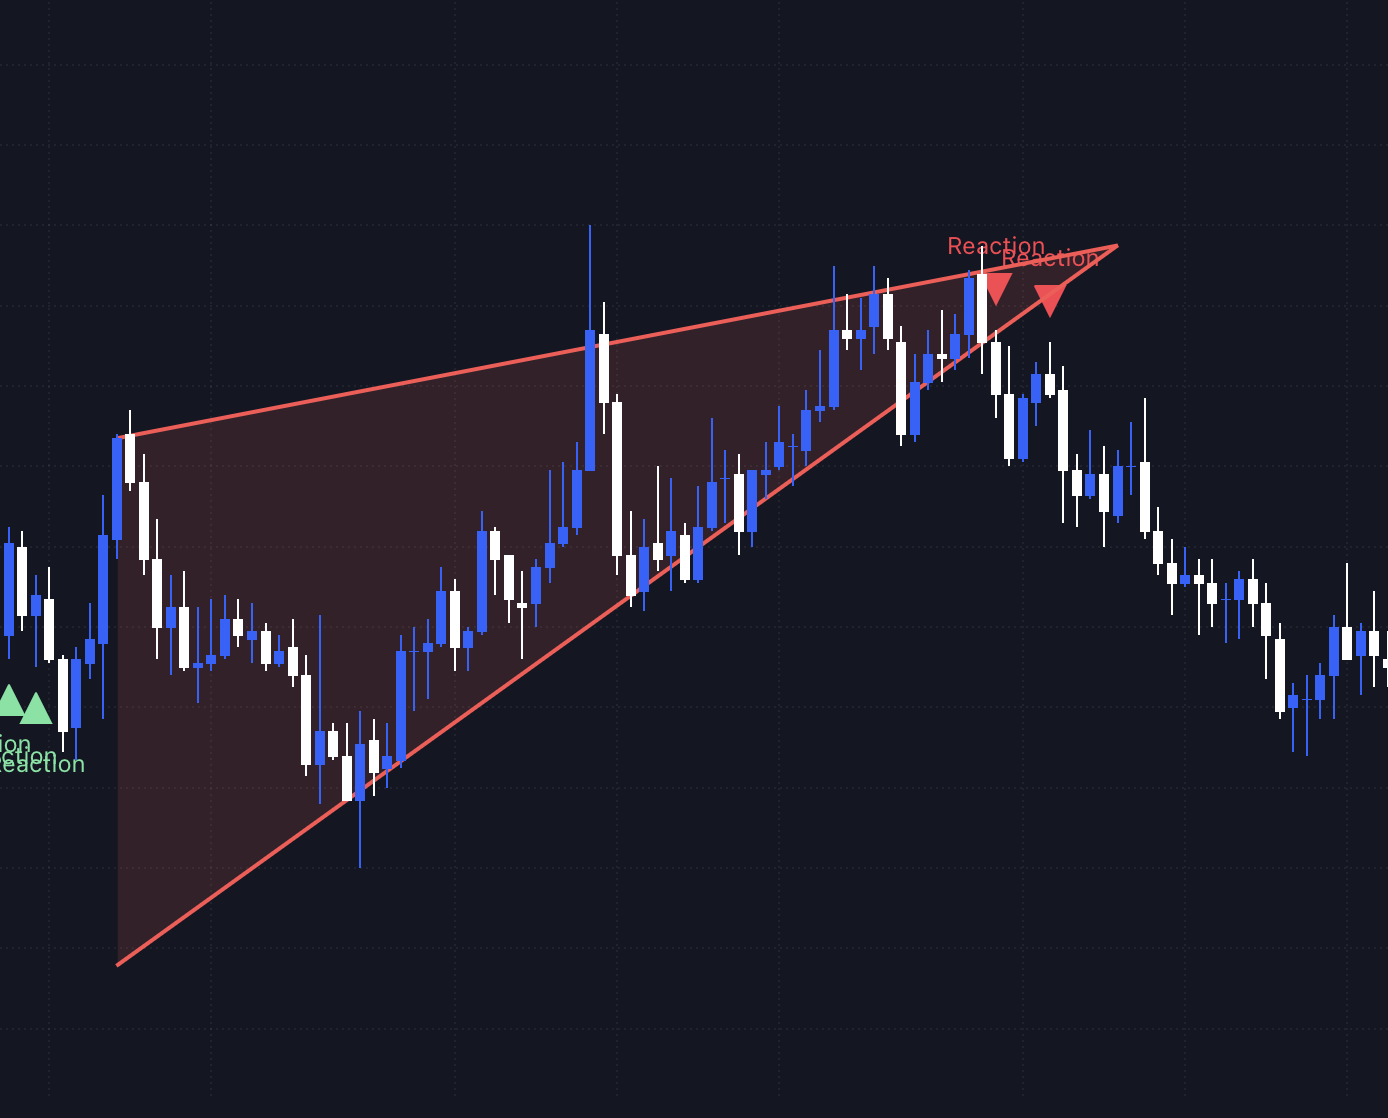
A red pattern means a large potential for a fall when exiting the pattern.
Signal function: search for the rounded bottom and top on the graph
Signal function: search for entry points by level breakdown criteria and Smart Money concept (with filtering)
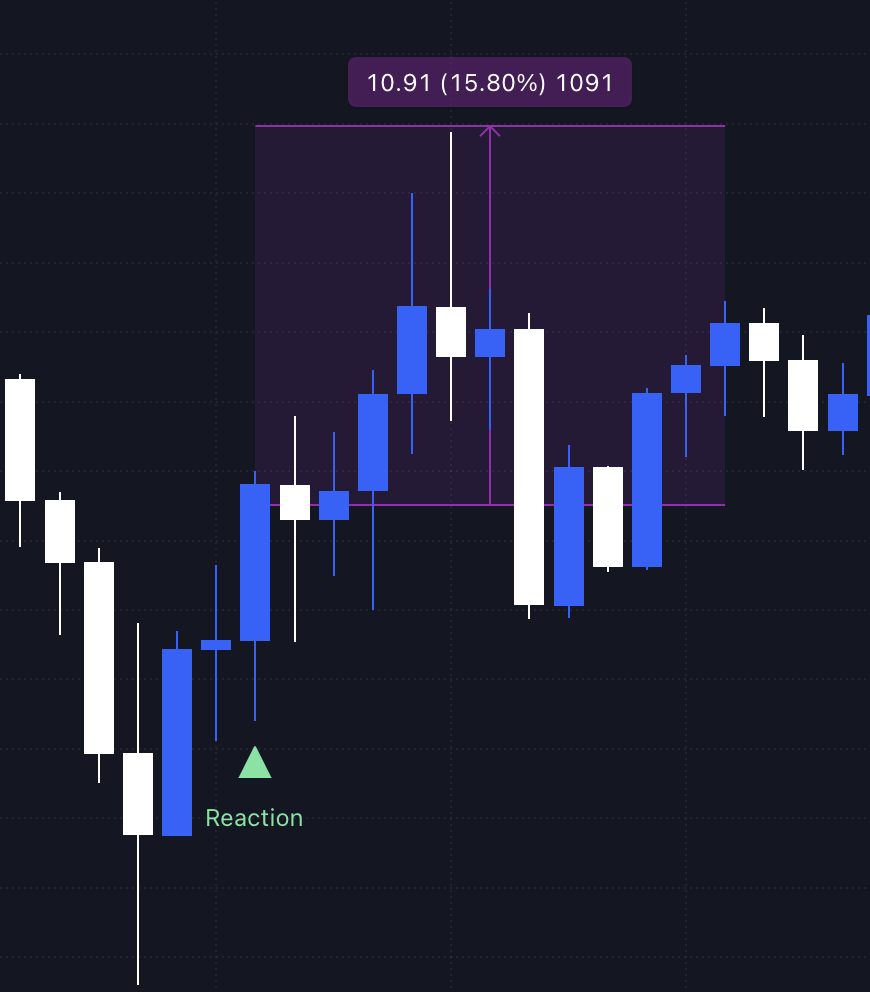
Signal function: search for a local market reversal signal